Introduction
The Applied Climate Information System (ACIS) Web
Services consists of five types of calls - StnMeta, StnData, MultiStnData, GridData and
General. Each of these calls is documented below. Each call has certain parameters that
are required and optional parameters that let you further refine your request.
Web service calls can be made in several ways. Basic calls can be made via http
requests from a web browser with the complete call specified in the url. More advanced
calls require a JSON object to adequately specify the
request. Such requests can be submitted to the ACIS server from most programming languages
by specifying the server address and a JSON "params" object. In this document, some of the
examples will take the form of a simple url, while others will provide just the "params"
object.
The ACIS Query Builder is a
useful tool for learning how the ACIS Web Services calls are constructed and how the
returned results are formatted. In the examples below, a link to the ACIS Query Builder
is provided with the page mostly populated. This will allow you to experiment with changing the parameters and
seeing how this affects the results.
I. StnMeta
The StnMeta web services call returns basic metadata for a station or stations meeting the specified criteria.
- Required parameters
One or more of the following keys must be specified:
| Key | Description |
|---|
| sids |
Station identifier(s) and optional id types codes. Can be any of the id types in Table 1. Ambiguous identifiers require
the station id type be appended to the identifier, separated by a space (e.g. BUFthr 9 or BUFthr thrdx). The value associated with this
key can be either a single id or an array of ids. This key cannot be combined with any of the other keys in this table. |
|---|
| county |
County (FIPS) id. Made up of a 2-digit state and 3-digit county id.
List of FIPS codes. |
|---|
| climdiv |
NCDC Climate Division. Consists of a 2-letter state abbreviation and 2-digit climate division id (e.g. FL01).
Map of climate
divisions. |
|---|
| cwa |
NWS County Warning Area. Three-letter
forecast office
identifiers. |
|---|
| basin |
River basin id. Eight-digit (subbasin)
USGS Hydrologic Unit Codes. |
|---|
| state |
State postal abbreviation. Two-letter abbreviations. A
map and list are available on Wikipedia for reference. The 50 states plus territories (AS, GU, MP, PR, VI), freely
associated states (FM, MH, PW), and federal district (DC) are available. Note that using DC may be somewhat unreliable because many
stations are listed as either MD or VA, rather than DC, in their metadata. |
|---|
| bbox |
Bounding box. A latitude/longitude bounding box defined in decimal degrees (West, South, East, North) with negative values
indicating west longitude and south latitude (e.g. -90.7, 40.5, -88.9, 41.5). |
|---|
The above keys can be specified with a single value or an array of values
(see Example 1.4 below). A combination of any of the keys listed above (except
sids) can be provided to further refine your request (see Example 1.5).
Table 1. Station Id Type Codes
| Code | Type | Description | Example |
|---|
| 1 | wban | 5-digit WBAN id | 14742 |
| 2 | coop | 6-digit COOP id | 304174 |
| 3 | faa | 3-character FAA id | LAX |
| 4 | wmo | 5-digit WMO id | 72223 |
| 5 | icao | 4-character ICAO id | KGRR |
| 6 | ghcn | 11-character GHCNd id | USW00003927 |
| 7 | nwsli or shef | 5-character NWSLI | AURN6 |
| 9 | thrdx | 6-character ThreadEx id | HSVthr |
| 10 | cocorahs | 8-character CoCoRaHS id | NYTM0004 |
| 19 | tscan | TSCAN id | 3056 |
| 29 | cadx | CA multi-station index id | |
| Following are currently only used for hourly data |
|---|
| 11 | deos | 4-character DEOS id | DAGF |
| 12 | mowx | MO mesonet id | |
| 13 | miwx | 3-character Enviroweather id | lan |
| 17 | scan | SCAN id | 2011 |
| 22 | oardc | 4-character OARDC id | asht |
| 26 | newa | 3- or 6-character NEWA id | gfr |
| 27 | culog | 6-character CULOG id | cu_gfr |
| 28 | njwx | NJ mesonet id | 1101 |
| 30 | ucc | UCC mesonet id | 42.32 |
| 31 | nwon | 7-character NEWA-Onset id | ny_genc |
| 32 | ghcnh | 11-character GHCNh id | USW00012968 |
- Optional parameters
Any of the following keys can be added to the web services call:
| Key | Description |
|---|
| meta |
Metadata items to be returned. A string or array of one or more of the metadata codes found in Table 2. If not specified, the default items
indicated in Table 2 will be returned. If valid_daterange is specified, elems must also be specified and
an array will be returned containing the valid date range for each variable, in the order specified in elems. |
|---|
| elems |
Elements. An array of one or more of the codes (or Var Majors) found in Table 3. Only stations reporting any of the elements
specified will be returned. |
|---|
| sdate |
Start date (yyyy-mm-dd or yyyymmdd). Beginning of desired date range. If used, request must also contain edate.
Only stations with any data between sdate and edate will be returned. |
|---|
| edate |
End date (yyyy-mm-dd or yyyymmdd). End of desired date range. If used, request must also contain sdate.
Only stations with any data between sdate and edate will be returned. |
|---|
| date |
Date (yyyy-mm-dd or yyyymmdd). Can be used in place of sdate/edate, if only a single date is adequate to define your request.
Only stations with data for the given date will be returned. |
|---|
| output |
Type of output (json or csv). The default is json. If meta is specified, json is the only output option. |
|---|
Table 2. Meta Codes
| Code | Description |
|---|
| name * | Station name |
| state * | 2-letter state abbrev |
| sids * | Array of station ids/types |
| sid_dates | Array containing date range for each station ids/types |
| ll * | Longitude and latitude (decimal degrees) |
| elev * | Elevation (feet) |
| uid * | Unified ACIS id |
| county | 5-digit FIPS county id |
| climdiv | 4-character climate division id |
| valid_daterange | Valid date range (by variable) |
| * indicates defaults |
|---|
Table 3. Element Codes
| Code | Var Major | Description |
|---|
| maxt | 1 | Maximum temperature (°F) |
| mint | 2 | Minimum temperature (°F) |
| avgt | 43 | Average temperature (°F) |
| obst | 3 | Obs time temperature (°F) |
| pcpn | 4 | Precipitation (inches) |
| snow | 10 | Snowfall (inches) |
| snwd | 11 | Snow depth (inches) |
| | 13 | Water equivalent of snow depth (inches) |
| | 7 | Pan evaporation (inches) |
| cdd | - | Cooling Degree Days (default base 65) |
| hdd | 45 | Degree days below base (default base 65) |
| gdd | 44 | Degree days above base (default base 50) |
| cddXX | - | Cooling Degree Days; where XX is base temperature |
| hddXX | - | Heating Degree Days; where XX is base temperature |
| gddXX | - | Growing Degree Days; where XX is base temperature |
Degree days can also be specified within an elems
object
with the keys "name" (or "vX") and "base". |
|---|
- Results
Results from a successful StnMeta call with the output type of "json" will
take the form of a JSON object with a single key - "meta". The value associated with the
"meta" key will be an array of objects - one object per station. These station objects
will consist of key/value pairs corresponding to the meta items requested (or
defaults, if not explicitly specified).
If valid_daterange is returned, the
value will be an array of arrays. There will be one array per element requested (in the
order requested). These arrays will consist of the begin and end dates, each in the form
yyyy-mm-dd (see Examples 1.2 and 1.5). If the element is not available for the station,
an empty array is returned for that element.
If ll is returned, it will be an array
containing longitude and latitude in decimals degrees (negative values indicate west
longitudes and south latitudes).
If sids is returned, it will be an array of
station ids/id types for the various identifiers associated with the station. The id type
codes employed can be found in Table 1.
If an output type of "csv" is requested, the output will be one station
per record with the comma-separated values: station id, name, longitude, latitude and
elevation.
- Examples
Example 1.1 - no elems or dates specified; returns default metadata for all stations in Albany County, NY:
https://data.rcc-acis.org/StnMeta?county=36001&output=csv
View in QueryBuilder
Example 1.2 - elems specified, but no dates specified; returns requested metadata for all stations in Albany County, NY reporting max and/or min temperature at any time in their period of record:
https://data.rcc-acis.org/StnMeta?county=36001&meta=name,valid_daterange&elems=maxt,mint
View in QueryBuilder
Example 1.3 - elems and dates specified; returns requested metadata for all stations in Albany County, NY reporting max and/or min temperature at any time between Jan 1 and Dec 31, 2009:
https://data.rcc-acis.org/StnMeta?county=36001&meta=name&elems=maxt,mint&sdate=2009-01-01&edate=2009-12-31
View in QueryBuilder
Example 1.4 - default station metadata for two stations:
https://data.rcc-acis.org/StnMeta?sids=KBWI 5,185718 2
View in QueryBuilder
Example 1.5 - obtain station name, state and valid date ranges for all stations that are in both the Boston CWA and either CT or RI that reported max or min temperature on June 21, 2011:
params = {
  "state":["CT","RI"],
  "cwa":"box",
  "elems":["maxt","mint"],
  "date":"2011-06-21",
  "meta":["name","state","valid_daterange"]
}
View in QueryBuilder
II. StnData
The StnData web services call returns raw or summarized climate data for a single station for a range of dates.
- Required parameters
| Key | Description |
|---|
| sid |
Station identifier. Can be any of the id types in Table 1. Ambiguous identifiers require
the station type be appended to the identifier, separated by a space (e.g. BUFthr 9 or BUFthr thrdx). |
|---|
| sdate |
Start date (yyyy-mm-dd or yyyymmdd). Beginning of desired date range. Can alternatively be just a year (yyyy) or a year and month
(yyyy-mm). If used, request must also contain edate. The code "por" can be used to indicate period of record. |
|---|
| edate |
End date (yyyy-mm-dd or yyyymmdd). End of desired date range. Can alternatively be just a year (yyyy) or a year and month
(yyyy-mm). If used, request must also contain sdate. The code "por" can be used to indicate period of record. |
|---|
| date |
Date (yyyy-mm-dd or yyyymmdd). Can be used in place of sdate/edate, if only a single date is adequate to define your request.
Can alternatively be just a year (yyyy) or a year and month (yyyy-mm). |
|---|
| elems |
Elements. An array of one or more of the codes (or Var Majors) found in Table 3 (see Example 2.1). Shortcuts are available for some
basic types of monthly data summaries. These element names can consist
of three parts and take the form "mly_aaa_bbbb". The indicator
"mly" indicates monthly data; "aaa" is the type of data reduction (or
summarization) that is performed on the data from Table 5 below;
and "bbbb" is the element code from Table 3 (see Example 2.2). The
most powerful method of specifying elems, however,
is as an array of objects. The structure of these objects is described
in the following table. Examples of requests using this method
can be found beginning with Example 2.3 below. |
|---|
- Elems objects
The elems specification can take the form of an array of JSON objects. The following table presents the options that are
available in these object specifications. Only name or vX is required.
| Key | Description | Example |
|---|
| name
| Variable name using codes from Table 3 above. Do not specify vX or vN when specifying variables
in this way.
| maxt |
|---|
| vX
| Var major or var major.minor from Table 3 above. Can be used in place of name. When specifying degree days
with vX 44 or 45, a base should be specified to avoid ambiguity. Value is numeric.
| 1 or 10.4 |
|---|
| vN
| Var minor. Must also specify vX when using this option. Additional documentation forthcoming.
| 4 |
|---|
| base
| Base temperature for degree days (in degrees F). Used with name or vX to define base temperature
used for degree day calculations. Base temperature defaults are given in Table 3.
| 40 |
|---|
| interval
| Time step of results - preferrably provided as an array that can have a length of either 1, 2 or 3, with the length indicating the temporal
precision of the returned values. A length of 1 indicates annual precision, 2 monthly
precision and 3 daily precision. The position of integers within the array signifies
the frequency of the values returned. The strings "dly", "mly" and "yly" are shortcuts
for commonly used intervals as shown in the following table:
| String | Array | Explanation |
|---|
| dly | [0,0,1] | A daily value is returned for each day (default). |
| mly | [0,1] | A monthly value is returned for each calendar month. |
| yly | [1] | An annual value is returned for each year. |
Using an array for interval facilitates a number of more complex requests. The
following examples demonstrate some of these capabilities:
| Array | Explanation | Example |
|---|
| [1,0,0] | Return a daily value once per year. In this example, daily rainfall on June 20 in each of a series of years. |
View in QueryBuilder |
| [0,1,0] | Return a daily value once per month. In this example, max temperature on the 15th of each month for a series of years. |
View in QueryBuilder |
| [0,0,7] | Return a daily value every seven days. In this example, seasonal growing degree days (since March 15) |
View in QueryBuilder |
| [0,3,0] | Return a daily value every third month. In this exmaple, 90-day precipitation accumulation. |
View in QueryBuilder |
| [0,3] | Return a monthly value every third month. In this example, 3-month (non-overlapping) precipitation sums. |
View in QueryBuilder |
Note: interval must be the same for all objects in an elems array.
| [0,1,0] or mly |
|---|
| duration
| Duration of summarization period as specified in Table 4. Default is 1.
| mtd |
|---|
reduce
(object)
| Type of data summary. When reduce is specified as an object, it is required to have the key reduce
and optionally add, n, and/or run_maxmissing.
| {"reduce":"max","add":"date","n":10} |
|---|
| reduce
| Data summary or reduction type from Table 5. |
|---|
| add
| One or more codes from Table 6 for additional information to be added to the
results. Some codes are only available for specific reduce types. |
|---|
| n
| Count of number of values to be returned. Maximum value is 100. Can only be used with reduce
of "max", "min" or "run". |
|---|
| run_maxmissing
| Number of missing values to allow before a run is terminated. Can only be used with
reduce of "run". |
|---|
|
reduce
(string)
| As a shortcut, reduce can be specified as a string. The string contains the data summary or reduction
type from Table 5. Other optional keys available in the full reduce object cannot be used in this
abbreviated form.
| cnt_ge_90 |
|---|
| season_start
| Start date of a season-to-date summarization. Only used with duration of "std".
Takes the form mm-dd or [mm,dd] for daily data or mm for monthly data.
| 06-20 |
|---|
| add
| One or more additional pieces of information to be appended to results as specified by codes in Table 7.
Only valid with duration of "dly".
| t,f |
|---|
| normal
| NCEI 30-Year Normals. Valid options: 1 or 91 for the 1991-2020 normal and "departure" or "91departure" for the departure from normal. The
NCEI 1981-2010 normals are also available as 81 for the normal or "81departure" for departure from normal. Available only for
selected elements and stations.
| 1 |
|---|
| maxmissing
| Integer value indicating the number of missing daily values to allow before a reduction is reported as missing. The
default is unlimited.
| 5 |
|---|
| prec
| Integer value indicating the number of decimal places of precision displayed in the results for this element.
| 3 |
|---|
smry
(object)
| Overall or column summary of the "data" portion of the request. This can be specified as an object or array of objects.
Each object is required to have the key reduce
and optionally add, n, and/or run_maxmissing. If the reduce object
described above employs the option n, smry cannot be used.
| {"reduce":"max","add":"date","n":10} |
|---|
| reduce
| Type of column summary from Table 8. |
|---|
| add
| One or more codes from Table 6 for additional information to be added to the
results. Some codes are only available for specific smry reduce types. |
|---|
| n
| Count of number of values to be returned. Maximum value is 100. Can only be used with
smry reduce of "max", "min" or "run". |
|---|
| run_maxmissing
| Number of missing values to allow before a run is terminated. Can only be used with
reduce of "run". |
|---|
|
smry
(string)
| As a shortcut, smry can be specified as a string or array of strings. Each string is a column summary
code from Table 8. Other optional keys available in the full smry object cannot be used in this abbreviated form.
If the reduce object employs the option n, smry cannot be used.
| mean |
|---|
| smry_only
| Return only the summary values defined by the smry field. The JSON object returned will only have "meta" and
"smry" fields (i.e. no "data" section). If used, must be specified for each elem.
Only valid value for this is 1. | 1 |
|---|
groupby
(will be deprecated)
| Groups together days or months of data for a year. This is an
array of the form ["year","mm-dd","mm-dd"], where mm-dd are the
starting and ending dates of the period to be grouped together (or
they can be just mm for monthly data). A shortcut for
["year","01-01","12-31"] is simply the string "year". Results will be
returned with all data between the specified group start
and end dates in an array identified by year (this year is the year
associated with the last data value in the array). Dates falling
within the groupby interval, but outside of the overall date range (sdate-edate)
will be filled with missing data. This option cannot be used with an interval of "yly".
| ["year","6","8"] |
|---|
Table 4. Duration Codes
| Code | Description | Valid with interval |
|---|
| integer | Length of period to be analyzed in units specified in interval;
values greater than 1 must specify reduce | dly, mly, yly |
| mtd | Month-to-date summary; must specify reduce | dly |
| ytd | Year-to-date summary; must specify reduce | dly, mly |
| std | Season-to-date summary; must specify reduce and season_start | dly, mly |
| dly | Daily data (not recommended, use 1 instead) | dly |
| mly | Monthly summary (not recommended, use 1 instead); must specify reduce | mly |
| yly | Yearly summary (not recommended, use 1 instead); must specify reduce | yly |
Table 5. Reduce Codes
| Code | Description |
|---|
| max | Maximum value for the period |
| min | Minimum value for the period |
| sum | Sum of the values for the period |
| mean | Average of the values for the period |
| stddev | Standard deviation of the values (GridData only) |
| list | Array of the values for the period |
| cnt_xx_yyy | Count of number of daily values passing threshold |
| pct_xx_yyy | Percent (integer) of daily values passing threshold |
| fct_xx_yyy | Fraction (float) of daily values passing threshold |
| first_xx_yyy | First occurrence of daily value passing threshold |
| last_xx_yyy | Last occurrence of daily value passing threshold |
| run_xx_yyy | Consecutive daily values passing threshold |
| | xx is operator (ge, gt, le, lt, eq, ne)
yyy is threshold (integer or floating point)
Examples: cnt_ge_0.01, pct_eq_100 |
Table 6. Reduce/Smry Add Codes
| Code | Description |
|---|
| mcnt | Count of missing values in the reduction period |
| date | Date of occurrence (for max, min, run) |
| value | Value on date of occurrence (for first and last) |
| rmcnt | Count of missing values in the run period (for run only) |
Table 7. Add Codes
| Code | Description |
|---|
| f | Flags |
| i | Station ID associated with data |
| n | Network associated with data:
| 0 - Unknown |
1 - TD3200 |
2 - TD3210 |
| 4 - SHEF |
5 - AWDN |
7 - CF6 |
| 8 - RCC keyed |
9 - NRCC local |
13 - WRCC local |
| 14 - SRCC local |
15 - DSM |
16 - TD3206 |
| 17 - GHCN-D |
19 - CF6 overriding GHCN-D |
52 - TD3205 |
| 53 - TD3299 |
54 - ThreadEx |
56 - CRB |
|
| s | Source flag |
| t | Time of observation |
| v | Var minor associated with data (documentation forthcoming) |
Table 8. Smry Codes
| Code | Description |
|---|
| max | Maximum value for the column |
| min | Minimum value for the column |
| sum | Sum of values in the column |
| mean | Average of values in the column |
| cnt_xx_yyy | Count of number of values in column passing threshold |
| pct_xx_yyy | Percent (integer) of values in column passing threshold |
| fct_xx_yyy | Fraction (float) of values in columnn passing threshold |
| run_xx_yyy | Consecutive column values passing threshold |
| | xx is operator (ge, gt, le, lt, eq, ne)
yyy is threshold (integer or floating point)
Examples: cnt_ge_0.01, run_le_32 |
- Optional parameters
| Key | Description | Example |
|---|
| meta |
Metadata items to be returned. A string or array of one or more of the metadata codes found in Table 2. If not specified, the default items
indicated in Table 2 will be returned. An empty array indicates no metadata should be returned. |
"name" or ["ll","elev"] |
|---|
| output |
Type of output (json or csv). If not specified, default is JSON. CSV is unavailable for some requests, such as those including
meta, add, or smry. |
"json" |
|---|
- Results
The results of web services calls can be returned as csv (comma
separated values) or JSON objects. In both cases, missing data values are
returned as "M" and trace values of precipitation, snowfall or snow
depth are returned as "T". Accumulated values will have an "A" appended
to the value. However, if flags are requested via the add option,
trace values will have a value of zero and a "T" as the flag and
accumulated values will have "A" as the flag, rather than appended to the value.
Data returned as csv have the station name as the first record in the
results. Subsequent records contain the values, with one record
per day for daily data, one record per month for monthly data or one
record per year for yearly data. The first value in each record is the
date (yyyy-mm-dd for daily, yyyy-mm for monthly, yyyy for yearly)
followed by the requested variables in the order specified in the
request.
Examples 2.1 and 2.2 below return the results in csv for daily and
monthly data, respectively.
If "json" is specified as the output format, the results are returned in a JSON object. Each value specified in the
meta array is included as a name/value pair in the "meta" portion of the returned object. If meta was not specified,
the default meta values will be returned. If meta was an empty array, there will be no "meta" section in the results.
The data values will be returned in an array of arrays with the key
"data". There will be one array per day (month or year, as specified),
with the values date (yyyy-mm-dd for daily, yyyy-mm for monthly, yyyy
for yearly) followed by the individual data values in the order
specified in the request.
If smry was specified, the summary data will be returned as an array of values with the key "smry". If smry_only
is specified, there will be no "data" section in the results.
If the request results in an error, the error message will appear in
the return for csv or as a key/value pair in JSON, with the key
"error" and the error message as a string value.
- Examples
Example 2.1 - Daily max and min temperature, precipitation, snowfall and snow depth for Jan 1-10, 2009:
https://data.rcc-acis.org/StnData?sid=304174&sdate=2009-01-01&edate=2009-01-10&elems=1,2,4,10,11&output=csv
View in QueryBuilder
Example 2.2 - Monthly highest max temperature and lowest min temperature for Jan-Dec 2008:
https://data.rcc-acis.org/StnData?sid=KCAR&sdate=2008-01&edate=2008-12&elems=mly_max_maxt,mly_min_mint&output=csv
View in QueryBuilder (standard specification)
View in QueryBuilder (elements shortcut)
Example 2.3 - Average daily temperature for St. Louis for June 1-30, 2012, first with time of observation and station id added,
then with precision of zero (even/odd rounding):
param = {
  "sid":"13994",
  "sdate":"2012-6-1",
  "edate":"2012-6-30",
  "meta":"name",
  "elems":[
    {"name":"avgt","interval":"dly","duration":"dly","add":"t,i"},
	{"name":"avgt","interval":"dly","duration":"dly","prec":0}
  ]
}
View in QueryBuilder
Example 2.4 - Monthly total precipitation for 6/1999-12/2000. First with no limit on number of missing values and second allowing no missing
data in reduction. In each case, report the number of missing values in the month.
params = {
  "sid":"302627",
  "sdate":"1999-6",
  "edate":"2000-12",
  "elems":[
    {"name":"pcpn","interval":[0,1],"duration":1,"reduce":{"reduce":"sum","add":"mcnt"}},
	{"name":"pcpn","interval":[0,1],"duration":1,"reduce":{"reduce":"sum","add":"mcnt"},"maxmissing":0}
  ]
}
View in QueryBuilder
Example 2.5 - Month-to-date average temperature and departure from normal for June 25, 2009:
params = {
  "sid":"304174",
  "date":"2009-06-25",
  "meta":["name","state"],
  "elems":[
    {"vX":43,"duration":"mtd","reduce":"mean"},
	{"vX":43,"normal":"departure","duration":"mtd","reduce":"mean"}
  ]
}
View in QueryBuilder
Example 2.6 - Period of record maximum temperatures and date of occurrence for every day of the year:
params = {
  "sid":"304174",
  "sdate":"por",
  "edate":"por",
  "meta":["name","state"],
  "elems":[{"name":"maxt","interval":[0,0,1],"duration":1,"smry":{"reduce":"max","add":"date"},"smry_only":1,"groupby":"year"}]
}
View in QueryBuilder
Example 2.7 - For each year between 1980 and 1985, find the longest run of days with min temperature <= 32 degrees between July 1 and June 30.
Add the ending date of the run, number of missing values in the entire period and number of missing values in the run to the results. Do this first
allowing no missing days in the run and second allowing up to 2 missing days in the run (notice difference in 1982 in results):
params = {
  "sid":"300331",
  "sdate":"1980-6-30",
  "edate":"1985-6-30",
  "meta":"name",
  "elems":[
    {"name":"mint","interval":[1,0,0],"duration":"std","season_start":"7-1","reduce":{"reduce":"run_le_32","add":"date,mcnt,rmcnt","n":1}},
    {"name":"mint","interval":[1,0,0],"duration":"std","season_start":[7,1],"reduce":{"reduce":"run_le_32","add":"date,mcnt,rmcnt","n":1,"run_maxmissing":2}}
  ]
}
View in QueryBuilder
Example 2.8 - Get the date of the last "spring" (July 1-June 30) temperature <= 28 degrees for the years 1991-2000. Also report what
the min temperature was on that date:
params = {
  "sid":"118740",
  "sdate":"1991-6-30",
  "edate":"2000-6-30",
  "elems":[{"name":"mint","interval":[1,0,0],"duration":"std","season_start":[7,1],"reduce":{"reduce":"last_le_28","add":"value"}}]
}
View in QueryBuilder
Example 2.9 - Request generating an error (i.e. requested February 29 in non-leap year):
params = {
  "sid":"lax",
  "date":"2023-2-29",
  "meta":"[]",
  "elems":[{"name":"pcpn","interval":[0,0,1],"duration":1}]
}
View in QueryBuilder
III. MultiStnData
The MultiStnData web services call returns data for multiple stations.
- Required parameters
| Key | Description |
|---|
| sdate |
Start date (yyyy-mm-dd or yyyymmdd). Beginning of desired date
range. Can alternatively be just a year (yyyy) or a year and month
(yyyy-mm). If used, must also specify an edate. |
|---|
| edate |
End date (yyyy-mm-dd or yyyymmdd). End of desired date range. Can alternatively be just a year (yyyy) or a year and month
(yyyy-mm). If used, must also specify an sdate. |
|---|
| date |
Date (yyyy-mm-dd or yyyymmdd). Can be used in place of sdate/edate, if only a single date is adequate to define your request.
Can alternatively be just a year (yyyy) or a year and month (yyyy-mm). |
|---|
| elems |
Elements. See the discussion of elems and elems objects in the StnData section
above. |
|---|
| In addition, one of the following keys defining the area/stations of interest
must be specified (can be an array): |
| county
| One of more county FIPS codes (e.g. 09001) |
|---|
| climdiv
| One of more state/climate division identifiers (e.g. NY09) |
|---|
| cwa
| One or more NWS County Warning Areas (e.g. BOI) |
|---|
| basin
| One of more drainage basins (8-digit HUC) (e.g. 01080205) |
|---|
| state
| One or more 2-letter state postal abbreviations (e.g. ["WA","OR"]) |
|---|
| bbox
| Bounding box specified in decimal degrees (W,S,E,N) (e.g. [-90, 40, -88, 41]) |
|---|
| sids
| One or more station ids as found in Table 1 (e.g.["171175","KBTV","14739"]) |
|---|
- Optional parameters
| Key | Description |
|---|
| meta |
Metadata items to be returned for each station. A string or array of one or more of the metadata codes found in Table 2. If not specified, the default items
indicated in Table 2 will be returned. |
|---|
| output |
Type of output (json or csv). If not specified, default is JSON. CSV is unavailable for some requests, such as those including
meta, add, smry or a range of dates. |
|---|
- Results
The results of web services calls can be returned as csv (comma
separated values) or JSON objects. In both cases, missing data values
are returned as "M" and trace values of precipitation, snowfall or snow
depth are returned as "T". Accumulated values will have an "A" appended
to the value. However, if flags are requested via the add option,
trace values will have a value of zero and a "T" as the flag and
accumulated values will have "A" as the flag, rather than appended to the value.
Data returned as csv have one record per station. Each record contains
the meta elements station id, name, state, longitude, latitude, and elev followed
by the requested data elements in the order specified in the request.
Examples 3.1 and 3.2 below return the results in csv for a day and a
month of data, respectively.
If "json" is specified as the output format, the results are returned
in a JSON object. This object has the single keyword "data", which
is an array of objects. Each object in the "data" array contains the
results for a single station as described in the StnData results
section above.
If the request results in an error, the error message will appear in
the return for csv or in a key/value pair in JSON, with the key
"error" and the error message as a string value.
- Examples
Example 3.1- Max and min temperature data for February 2, 2009 for all stations in CT and RI:
https://data.rcc-acis.org/MultiStnData?state=CT,RI&date=2009-02-02&elems=maxt,mint&output=csv
View in QueryBuilder
Example 3.2 - Monthly mean temperature and total precipitation for August 2011 for all stations in Delaware Climate Division 1:
https://data.rcc-acis.org/MultiStnData?climdiv=DE01&date=2011-8&elems=mly_mean_avgt,mly_sum_pcpn&output=csv
View in QueryBuilder
Example 3.3 - Monthly year-to-date precipitation departure from normal for all stations in Texas Climate Divison 1 with no missing data for Jan-Dec 2011:
params = {
  "climdiv":"tx01",
  "sdate":"2011-01",
  "edate":"2011-12",
  "meta":"name",
  "elems":[{"name":"pcpn","interval":[0,1],"duration":"ytd","reduce":"sum","maxmissing":0,"normal":"departure"}]
}
View in QueryBuilder
Example 3.4 - Annual precipitation totals for all stations in a bounding box for 2008-2010, allowing a maximum of 7 missing days in a
year. Also report number of missing days for each year and summarize these yearly values into a maximum, minimum and mean for the period:
params = {
  "bbox":"-102,48,-98,50",
  "sdate":"2008-01",
  "edate":"2010-12",
  "meta":"name,state,ll",
  "elems":[{"name":"pcpn","interval":[1],"duration":1,"reduce":{"reduce":"sum","add":"mcnt"},"maxmissing":7,"smry":"max,min,mean"}]
}
View in QueryBuilder
IV. GridData
The GridData web services call returns data (or an image) from a gridded data set.
- Required parameters
| Key | Description |
|---|
| grid |
Gridded data set identifier. Code for the gridded data set of interest from Table 9. |
|---|
| sdate |
Start date (yyyy-mm-dd or yyyymmdd). Beginning of desired date
range. Can alternatively be just a year (yyyy) or a year and month
(yyyy-mm). If used, request must also contain edate. |
|---|
| edate |
End date (yyyy-mm-dd or yyyymmdd). End of desired date range. Can alternatively be just a year (yyyy) or a year and month
(yyyy-mm). If used, request must also contain sdate. |
|---|
| date |
Date (yyyy-mm-dd or yyyymmdd). Can be used in place of sdate/edate, if only a single date is adequate to define your request.
Can alternatively be just a year (yyyy) or a year and month (yyyy-mm). |
|---|
| elems |
Elements. See the discussion of elems and elems objects in the StnData section
above. Available options and differences from the description under StnData are presented below. |
|---|
| In addition, one of the following keys must be specified to indicate
area of interest: |
| loc |
Location. Longitude and latitude in decimal degrees of a point of interest. Results will contain data for the grid point
closest to this location. |
|---|
| state |
State. One or more 2-letter state postal abbreviations. Results will be returned for a bounding box that encompasses
all states in the array. For instance, specifying just ["ME","FL"] will return the entire East Coast. |
|---|
| bbox |
Bounding box. Bounding box specified in decimal degrees (W,S,E,N) (e.g. [-90, 40, -88, 41]) |
|---|
- Elems objects
The elems specification can take the form of a string or an array of JSON objects. The following table presents the options that are
available for use in GridData. Only name or vX is required.
| Key | Description | Example |
|---|
| name
| See Table 3 (except obst, snow, and snwd) and additional codes in Table 11 below.
| maxt |
|---|
| vX
| See Table 3 (except 3, 10, 11, 13, and 7) and additional codes in Table 11 below. Value is numeric.
| 1 or 10.4 |
|---|
| base
| See above.
| 40 |
|---|
| interval
| See above.
| mly |
|---|
| duration
| See above.
| mtd |
|---|
| reduce
| In GridData, this can only be specified as a string (or an object with the single key "reduce"). The string contains the data
summary or reduction type from Table 5 (except "run_xx_yyy" which is not available in GridData).
| cnt_ge_90 |
|---|
| season_start
| See above.
| 06-20 |
|---|
normal
| Gridded normals are not available at this time.
| 1 |
|---|
| maxmissing
| See above.
| 3 |
|---|
| smry
| In GridData, this can only be specified as a string (or an object with the single key "reduce"). Each string contains
a column summary code from Table 8.
| mean |
|---|
| smry_only
| See above.
| 1 |
|---|
| units
| Set units of output data. Valid choices include: degreeF (temperature default), degreeC, degreeK, inch (precipitation default)
and mm.
| degreeC |
|---|
| area_reduce
| Area reduction code. Grid data summarization by area as outlined in Table 10. Cannot be used when an image output is requested.
| county_max |
|---|
| prec
| Integer value indicating the number of decimal places of precision displayed in the results for this element.
| 3 |
|---|
Table 9. Grid Codes
| Code | Description | Area | Period |
|---|
| 1 | NRCC Interpolated | Continental US | 1950-present |
| 2 | Multi-Sensor Precip Estimates | Continental US | 2006-present
|
| 3 | NRCC Hi-Res | US East of Rockies | Temperature: 1998-present
Precipitation: 2002-present |
| 4-16 | NARCCAP * (will be deprecated) | Continental US | 1970-2000, 2040-2070 |
|
4: CRCM + NCEP (historical only)
5: CRCM + CCSM
6: CRCM + CGCM3
9: MM5I + NCEP (historical only)
10: MM5I + CCSM
11: RCM3 + NCEP (historical only)
12: RCM3 + CGCM3
13: RCM3 + GFDL
14: WRFG + NCEP (historical only)
15: WRFG + CCSM
16: WRFG + CGCM3 |
| 21 | PRISM | Continental US | Daily: 1981-present
Monthly/Yearly: 1895-present (see Table 11) |
| * Be aware of idiosyncrasies before using NARCCAP grid sets. |
|---|
Table 10. Area Reduction Codes
| Code | Description |
|---|
| aaaa_max | Maximum grid value in area |
| aaaa_min | Minimum grid value in area |
| aaaa_mean | Average of all grid values in the area |
| | aaaa is area type ("county", "climdiv", "basin", "state") |
Table 11. Element Codes for Monthly/Yearly PRISM Data
| Code | Var Major | Description |
|---|
| mly_maxt | 91 | Monthly mean maximum temperature (°F) |
| mly_mint | 92 | Monthly mean minimum temperature (°F) |
| mly_avgt | 99 | Monthly mean average temperature (°F) |
| mly_pcpn | 94 | Monthly precipitation sum(inches) |
| yly_maxt | 95 | Yearly mean maximum temperature (°F) |
| yly_mint | 96 | Yearly mean minimum temperature (°F) |
| yly_avgt | 100 | Yearly mean average temperature (°F) |
| yly_pcpn | 98 | Yearly precipitation sum (inches) |
These codes are used to access monthly/yearly gridded datasets directly,
not derived monthly/yearly means or sums reduced from daily gridded data.
Only available for
some gridded datasets as indicated in Table 9. |
|---|
- Optional parameters
| Key | Description |
|---|
| meta |
Metadata items to be returned. Available options are "ll" for latitude and longitude and "elev" for elevation of each
grid point. |
|---|
| output |
Type of output (json or image). Note that this input is case-sensitive. If not specified, default is "json". The option
"image" will return a PNG image; "json" will return a JSON object containing all the grid point data, unless an
image object is specified, in which case a PNG image will be embedded in the returned JSON object
along with other information about the image. |
|---|
| image |
Map specifications. This object contains specifications for production of a PNG image. See "Image object" section below. |
|---|
- Image object
The following table presents the options that are available for the image object. Only width or
height is required.
| Key | Description | Default |
|---|
| info_only
| If only information about the map is desired, not the png image, this should be set to "1". If not specified, png image
is returned in data portion of JSON object. The output must be "json" to use this option.
| - |
|---|
| proj
| Projection. Currently, "lcc" (Lambert conformal conic) is the only available option.
| lcc |
|---|
| overlays
| Array of types of map overlays. Specify "state" for state borders and/or "county" for county borders. Line width and color
can also be specified, separated by colons. For example, ["state:2:red","county:1:blue"].
| (no overlays) |
|---|
| interp
| Type of interpolation. Options are "cspline" for cubic spline or "none" for no interpolation.
| cspline |
|---|
| cmap
| Color map. Definitions from mapplotlib.
Note that color map names are case-sensitive.
| jet |
|---|
| width
| Width of png image in pixels. Only width or height should be specified - not both. Other dimension
will be scaled appropriately.
| - |
|---|
| height
| Height of png image in pixels. Only width or height should be specified - not both. Other dimension
will be scaled appropriately.
| - |
|---|
| levels
| Contour levels. An array of values to be used as contour levels on the map.
| (selected by server) |
|---|
- Results
If the GridData request is for a single grid point, the results will
look much the same as for StnData. Each value specified in the
meta array is included as a name/value pair in the "meta"
portion of the returned object. The data values will be returned
in an array of arrays with the key "data". There will be one array per
day (month or year, as specified), with the values date (yyyy-mm-dd
for daily, yyyy-mm for monthly, yyyy for yearly) followed by the
individual data values in the order specified in the request. Missing values are returned
as -999. If smry was specified, the summary data will be returned as an
array of values with the key "smry". If smry_only is specified, there will
be no "data" section in the results. See Example 4.1.
Otherwise, if "json" is specified as the output format and there is no image object in the request, the results
are again returned in a JSON object much like in StnData. Each item specified in the request's meta
array is included as a key
in the "meta" portion of the returned object. The data values are in the
portion of the returned object under the key "data". If a
smry was requested, these values in the return will have the key "smry". If no areal reduction was specified (area_reduce),
instead
of individual values in the "meta", "data" and "smry" portions of the
results, there are arrays of arrays with each of the values
corresponding to an individual grid point. The first level of arrays can
be visualized as latitude bands with each of these containing
an array of values for each longitude along the latitude band. See
example 4.2. Missing values are returned as -999.
If "json" is specified as the output format and area_reduce
is specified, the result will be a JSON object
with the keys "data" and, if requested, "smry". The "data" section will
be an array of arrays. Each array will contain a date and an
object containing key/value pairs representing the area id and the
reduced value based on all grid points
in that area. The "smry" section will be an array of objects with the
object made up of key/value pairs as in "data". See Example 4.3.
If "json" is specified as the output format and there is an image
object in the request, the results will
contain a png image (a map) and information about that image. The keys
in the returned JSON object are: "data_bbox", "levels", "cmap", "range", "size"
and "data". The value of "data_bbox" consists of an array of two arrays defining the bounding box of
the map. The first array is the
longitude and latitude of the southwest corner of the map and the second array is the
longitude and latitude of the northeast corner of the map. The value of
"levels" is an array containing the contour
levels used on the map. These were either specified in the call or, if
absent, determined by the GridData server. The value of "cmap" (color
map) is an array of hexadecimal codes corresponding the the colors
used in the map for the various contour levels. There will be one more
cmap value than level, because the first color corresponds to values
less
than the first level and the last color is for values greater than the
last level. The "range" is an array containing the lowest and
highest individual grid values in the area covered by the map. The
"size" is an array containing the width and height of the png image in
pixels.
One of these was specified in the request and the other scaled by the
png creation routine. The "data" portion of the return is a base64
representation of the png image itself (see Example 4.5). If info_only is specified in the image object, the
"data" portion of the results (containing the png image) is omitted (see Example 4.4).
If "image" is specified as the output format, just the png image
(with Content-Type: image/png) will be returned (see Example
4.6).
If the request results in an error, the return will be a key/value
pair, with the key "error" and the error message as a string value.
- Examples
Example 4.1 - For a single grid point, monthly highest maximum
temperature by month for Jan-Jul 2012 and highest over the entire
period:
params = {
  "loc":"-95.36,29.76",
  "sdate":"2012-1",
  "edate":"2012-7",
  "grid":"3",
  "elems":[{"name":"maxt","interval":[0,1],"duration":1,"reduce":"max","smry":"max"}]
}
View in QueryBuilder
Example 4.2 - For the state of Delaware, retrieve August 2010
precipitation total (in millimeters) for each grid point. Include latitude and longitude of each grid point:
params = {
  "state":"de",
  "date":"2010-8",
  "grid":"1",
  "meta":"ll",
  "elems":[{"name":"pcpn","interval":[0,1],"duration":1,"reduce":"sum","units":"mm"}]
}
View in QueryBuilder
Example 4.3 - Lowest temperature for the winter of 2011-12 (i.e. 12/1/2011-2/29/2012) for each county in Vermont:
params = {
  "state":"vt",
  "date":"2012-2-29",
  "grid":"3",
  "output":"json",
  "elems":[{"name":"mint","interval":[1,0,0],"duration":"std","season_start":"12-1","reduce":"min","area_reduce":"county_min"}]
}
View in QueryBuilder
Example 4.4 - Retrieve only information about a map of highest maximum temperature in Nebraska during June 2012 (no png):
params = {
  "state":"ne",
  "grid":"1",
  "output":"json",
  "date":"2012-6",
  "elems":[{"name":"maxt","interval":[0,1],"duration":1,"reduce":"max"}],
  "image":{"info_only":1,"width":350}
}
View in QueryBuilder
Example 4.5 - Same as Example 4.4, but this time include map specifications (overlays, contour levels) and also get png image:
params = {
  "state":"ne",
  "grid":"1",
  "output":"json",
  "date":"2012-6",
  "elems":[{"name":"maxt","interval":[0,1],"duration":1,"reduce":"max"}],
  "image":{"proj":"lcc","overlays":["county:1:gray","state:2:purple"],"interp":"cspline","width":350,"levels":[90,95,100,105,110]}
}
View in QueryBuilder
Example 4.6 - Same as Example 4.5, but this time extend the area through Oklahoma and retrieve just the png image:
params = {
  "state":"ne,ok",
  "grid":"1",
  "output":"image",
  "date":"2012-6",
  "elems":[{"name":"maxt","interval":[0,1],"duration":1,"reduce":"max"}],
  "image":{"proj":"lcc","overlays":["county:1:gray","state:2:purple"],"interp":"cspline","width":350,"levels":[90,95,100,105,110]}
}
View map image
View in QueryBuilder
Example 4.7 - Annual precipitation totals for 2010-2012 for every climate division in Florida from PRISM yearly dataset:
params = {
  "state":"fl",
  "grid":"21",
  "date":"2012",
  "elems":[{"name":"yly_pcpn","area_reduce":"climdiv_mean"}]
}
View in QueryBuilder
V. Grid2
The Grid2 web services call returns data from a gridded data set. This is similar to the GridData call described above, but allows access
to a different group of gridded datasets and a slightly modified syntax. Eventually, GridData and Grid2 will be combined into a unified web services call to access any ACIS gridded
dataset. The endpoint for Grid2 is different than that used by all the other ACIS Web Services calls described elsewhere in this document.
It is https://grid2.rcc-acis.org/GridData. This url will eventually change when the two existing types of gridded data calls are merged.
- Required parameters
| Key | Description |
|---|
| grid |
This is differnt than the original ACIS GridData call. Datasets here are identified by either name or, in the case of LOCA and SNAP, a structure taking the
form: "name:model:scenario". The available "names" can be found in Table 12, available "models" (when applicable) are in Tables 13-15, and "scenario" (when applicable)
is either "rcp85" (high greenhouse gas and aerosol emissions scenario; for LOCA and SNAP) or "rcp45" (medium greenhouse gas and aerosol emissions scenario; LOCA only).
An example LOCA model grid specification is "loca:wmean:rcp85". |
|---|
| sdate |
See above. |
|---|
| edate |
See above. |
|---|
| date |
See above. |
|---|
| elems |
Elements. See "Elems objects" section of GridData documentation above. Grid2 also allows the use of nested elements, which will be documented at a later date.
See Table 16 for additional reductions (reduce) available in Grid2. |
|---|
| In addition, one of the following keys must be specified to indicate
area of interest: |
| loc |
See above. |
|---|
| state |
See above. |
|---|
| bbox |
See above. |
|---|
| county |
County (FIPS) id. Made up of a 2-digit state and 3-digit county id.
List of FIPS codes. |
|---|
Table 12. Grid Names
| Name | Description | Area | Period |
|---|
| prism | PRISM | Continental US | Daily: 1981-present
Monthly/Yearly: 1895-present (see Table 11) |
| nrcc-model | NRCC Hi-Res | US East of Rockies | Temperature: 1998-present
|
| nrcc-nn | NRCC Interpolated | Continental US | 1950-present |
| ncei-norm:91-20 | NCEI Gridded Normals | /Continental US | 1991
|
| livneh | Livneh | Continental US | 1950-2012 |
| loca | LOCA | Continental US | 1950-2099
|
| snap | SNAP | Alaska | Temperature: 1970-2099 |
Table 13. Precomputed LOCA/SNAP Model Codes
| Code | Description |
|---|
| allmax | Highest of 32 LOCA models (monthly only) |
| allmin | Lowest of 32 LOCA models (monthly only) |
| allmedian | Median of 32 LOCA models (monthly only) |
| wmean | Weighted mean of 32 LOCA models (monthly only) |
Table 14. Individual LOCA Models
| Model (case insensitive) |
|---|
| ACCESS1-0 |
| ACCESS1-3 |
| CCSM4 |
| CESM1-BGC |
| CESM1-CAM5 |
| CMCC-CM |
| CMCC-CMS |
| CNRM-CM5 |
| CSIRO-Mk3-6-0 |
| CanESM2 |
| EC-EARTH |
| FGOALS-g2 |
| GFDL-CM3 |
| GFDL-ESM2G |
| GFDL-ESM2M |
| GISS-E2-H |
| GISS-E2-R |
| HadGEM2-AO |
| HadGEM2-CC |
| HadGEM2-ES |
| IPSL-CM5A-LR |
| IPSL-CM5A-MR |
| MIROC-ESM |
| MIROC-ESM-CHEM |
| MIROC5 |
| MPI-ESM-LR |
| MPI-ESM-MR |
| MRI-CGCM3 |
| NorESM1-M |
| bcc-csm1-1 |
| bcc-csm1-1-m |
| inmcm4 |
Table 15. Individual SNAP Models
| Model (case insensitive) |
|---|
| GFDL-CM3 |
| NCAR-CCSM4 |
Table 16. Additional Grid2 Reduce Codes
| Code | Description |
|---|
| runcntzz_xx_yyy | Consecutive daily values passing threshold at least zz days long |
| runmax_xx_yyy | Maximum number of consecutive daily values passing threshold |
| | xx is operator (ge, gt, le, lt, eq, ne)
zz is minimum run length (integer)
yyy is threshold (integer or floating point)
Examples: runcnt5_lt_0.01, runmax_ge_0.01 |
- Optional parameters
| Key | Description |
|---|
| meta |
Metadata items to be returned. Available options are "ll" for latitude and longitude and "elev" for elevation of each
grid point. (As of this writing, "elev" was not yet available). |
|---|
| output |
Type of output (json, gif, geotiff). Note that this input is case-sensitive. If not specified, default is "json". The option
"gif" will return a multi-gif image; "geotiff" will return a geotiff output; and "json" will return a JSON object containing all the grid point
or areal reduction data. |
|---|
- Results
If the GridD2 request is for a single grid point, the results will
look much the same as for StnData. Each value specified in the
meta array is included as a name/value pair in the "meta"
portion of the returned object. The data values will be returned
in an array of arrays with the key "data". There will be one array per
day (month or year, as specified), with the values date (yyyy-mm-dd
for daily, yyyy-mm for monthly, yyyy for yearly) followed by the
individual data values in the order specified in the request. Missing values are returned
as -999. If smry was specified, the summary data will be returned as an
array of values with the key "smry". If smry_only is specified, there will
be no "data" section in the results. See Example 4.1.
If something other than a single point was requested and no areal reduction was specified (area_reduce),
instead of individual values in the "meta", "data" and "smry" portions of the
results, there are arrays of arrays with each of the values
corresponding to an individual grid point. The first level of arrays can
be visualized as latitude bands with each of these containing
an array of values for each longitude along the latitude band (as in the GridData
example 4.2). Missing values are returned as -999.
If "json" is specified as the output format and area_reduce
is specified, the result will be a JSON object
with the keys "data" and, if requested, "smry". The "data" section will
be an array of arrays. Each array will contain a date and an
object containing key/value pairs representing the area id and the
reduced value based on all grid points
in that area. The "smry" section will be an array of objects with the
object made up of key/value pairs as in "data" (see GridData Example 4.3).
If "gif" or "geotiff" is specified as the output format, just the image
will be returned.
If the request results in an error, the return will be a key/value
pair, with the key "error" and the error message as a string value.
- Examples
Example 5.1 - For a single grid point, obtain the monthly summarized precipitation data (mean of all LOCA models) for a year:
params = {
  "loc":"-76.0,42.5",
  "sdate":"2030-1",
  "edate":"2030-12",
  "grid":"loca:wmean:rcp45",
  "elems":[{"name":"pcpn","interval":[0,1],"duration":1,"reduce":"sum"}]
}
View in QueryBuilder
Example 5.2 - For each year, state mean of longest run of dry days:
params = {
  "grid":"loca:allmax:rcp45",
  "state": "tx",
  "sdate":"1990",
  "edate":"2000",
  "elems":[{"name":"pcpn","interval":[1],"reduce":"runmax_lt_0.01","area_reduce":"state_mean"}]
}
View in QueryBuilder
VI. General
The General web services calls return metadata for a geographic area. The type of geographic area from the "Area" column in
Table 12 is appended to the url after the word "General", preceeded by a slash ("/") as shown in the examples below.
- Required parameters
One of the following keys must be specified:
| Key | Description |
|---|
| state |
One or more two-letter state postal abbreviations. A
Wikipedia map or list is available
for reference. The 50 states plus territories (AS, GU, MP, PR, VI) and federal district (DC) are available. |
|---|
| id |
Identification number of the area of interest. Types of identifiers for each area are found in Table 12. |
|---|
| bbox |
Bounding box. A latitude/longitude bounding box defined in decimal degrees (West, South, East, North) with negative
values indicating west longitude and south latitude (e.g. -90.7, 40.5, -88.9, 41.5). |
|---|
Table 17. Area Information
| Area | ID Type | Available Meta Codes |
|---|
| state | Postal | id, name, bbox, geojson, state |
| county | FIPS | id, name, bbox, geojson, state |
| climdiv | Divison number | id, name, bbox, geojson, state |
| cwa | NWS CWA | id, name, bbox, geojson |
| basin | 8-digit HUC | id, name, bbox, geojson |
- Optional parameters
| Key | Description |
|---|
| meta |
A string or array of types of metadata to be returned. Available codes for each area type are found in Table 12.
If not specified, the name and area id will be returned. |
|---|
- Results
The results of General web services calls are returned as JSON
objects with the single key "meta", which is an array of objects.
Each object in the "meta" array contains the results for a single
subarea (e.g. climate division). Each item specified in the
meta array is included as a name/value pair.
If "geojson" is included in the meta input array, a GeoJSON object
will be included as part of the returned object with the keyword "geojson". GeoJSON is a format for encoding geographic data
structures. Example 6.3 shows how geojson will appear in the results.
- Examples
Example 6.1 - Get state, name and bounding box for New York State:
https://data.rcc-acis.org/General/state?state=NY&meta=state,name,bbox
View in QueryBuilder
Example 6.2 - Get state, name and id for all counties in a bounding box:
https://data.rcc-acis.org/General/county?bbox=-76,41,-75,42&meta=id,name,state
View in QueryBuilder
Example 6.3 - Get name, id and geojson for Nebraska climate division 1:
https://data.rcc-acis.org/General/climdiv?id=NE01&meta=id,name,geojson
View in QueryBuilder
Example 6.4 - Get id and name of all CWAs covering any part of Louisiana:
https://data.rcc-acis.org/General/cwa?state=LA&meta=id,name
View in QueryBuilder
Example 6.5 - Get id and name of all river basins in a bounding box:
https://data.rcc-acis.org/General/basin?bbox=-75,40,-72,42;meta=id,name
View in QueryBuilder
VII. Programming Examples
- StnMeta Example (JavaScript)
Metadata is retrieved for all stations in the bounding box within the latitude/longitude points 43°N,-109°W and
44°N,-110°W. The station name and precipitation starting and ending dates are displayed in an HTML table.
View Script

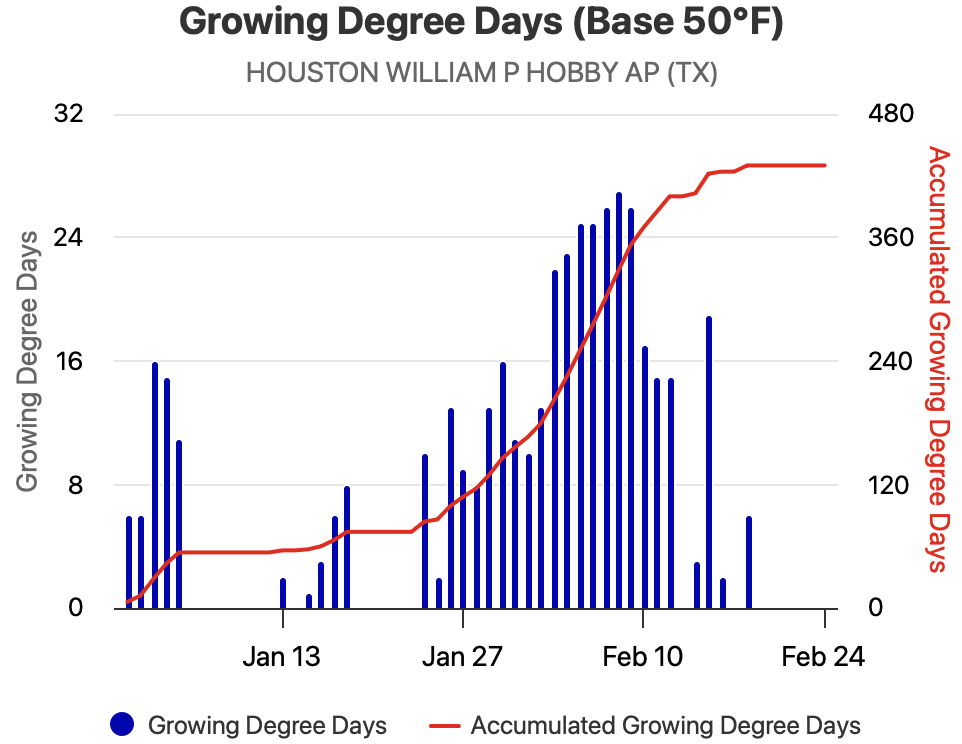
- StnData Example (JavaScript)
Growing degree day data using a base of 50°F is retrieved for Houston Hobby AP for the year to date. These data are then
plotted on an interative chart using the HighCharts JavaScript library.
View Script
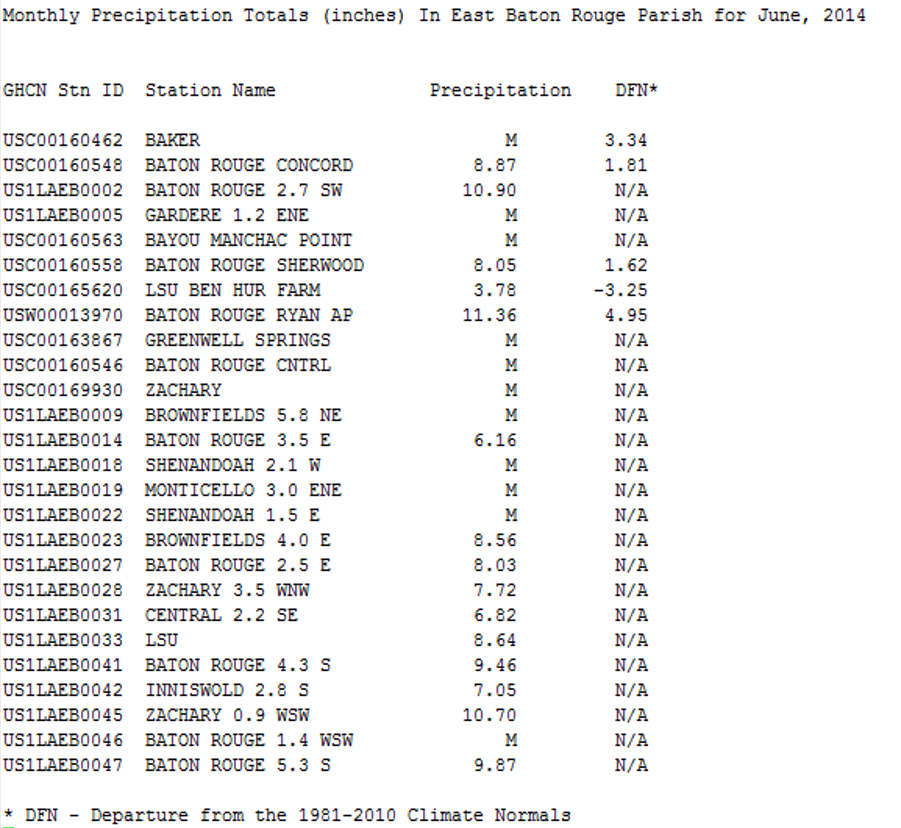
- MultiStnData Example (Python)
June 2014 monthly total precipitation as well as the deviation from NCDC's 1991-2020 Normal for all stations in the East Baton
Rouge Parish that had less than 3 days of missing data are requested. A table showing the station name,
precipitation total, and the departure from normal is printed to the screen.
View Script
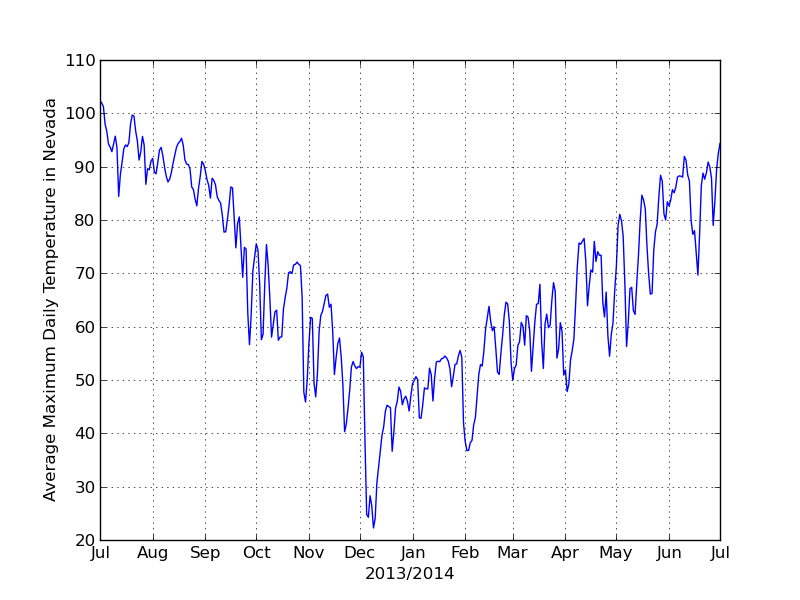
- GridData Examples (Python)
a. Spatial Summary of Gridded Data
The state averaged daily maximum temperatures from July 1, 2013 to July 1, 2014 are retrieved for Nevada using the NRCC Interpolated
gridded dataset. A daily time series chart of this data is then created.
View Script
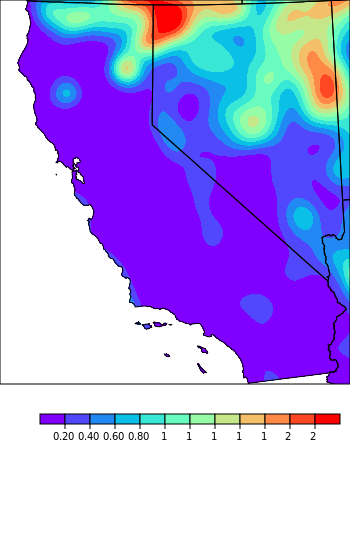
b. Temporal Summary of Gridded Data
The projected July 2040 monthly precipitation toal for California from the NARCCAP dataset using the CRCM + CGCM3 is acquired.
A map of the data is created as a .png
View Script
Updates
- 2012-07-20: Original release with GridData forthcoming. - kle
- 2012-08-02: Added
sids to MultiStnData options. Added evap and updated degree days specifications in Table 3.
Added base to elems object specifications. Added GridData documentation. - kle
- 2014-06-27: Major update including moving examples to jsFiddle, JavaScript programming example,
interval array documentation, added network codes to Table 7 and addition of
PRISM gridded data. - kle
- 2014-11-07: Added programming examples that show output and code in Python and JavaScript - las
- 2014-12-17: Changed css so links are displayed in orange (plain black before). Removed grids 7 and
8 from Table 9. Fixed couple typos. - kle
- 2015-01-23: Changed Example 2.5 to demonstrate use of vX in element definition. - kle
- 2016-03-02: Added snow water equivalent element to Table 3. - kle
- 2016-04-29: Noted that run reduction is not available for GridData. - kle
- 2017-10-04: Emphasized ambiguous ids need id type, added id types and networks, noted items to be deprecated, removed bogus area reduction codes, and other cleanup. - kle
- 2020-08-14: Added Grid2 documentation. - kle
- 2021-01-20: Additional Grid2 documentation. - kle
- 2023-09-21: General update and conversion of examples to QueryBuilder links. - kle
- 2023-10-02: Reformatted examples for legibility. - kle
- 2025-02-26: Removed JQuery and JavaScript, and made programming example output static images. - kle